What’s new in Remote: clearer workflows for payroll, contractors, benefits, and team management
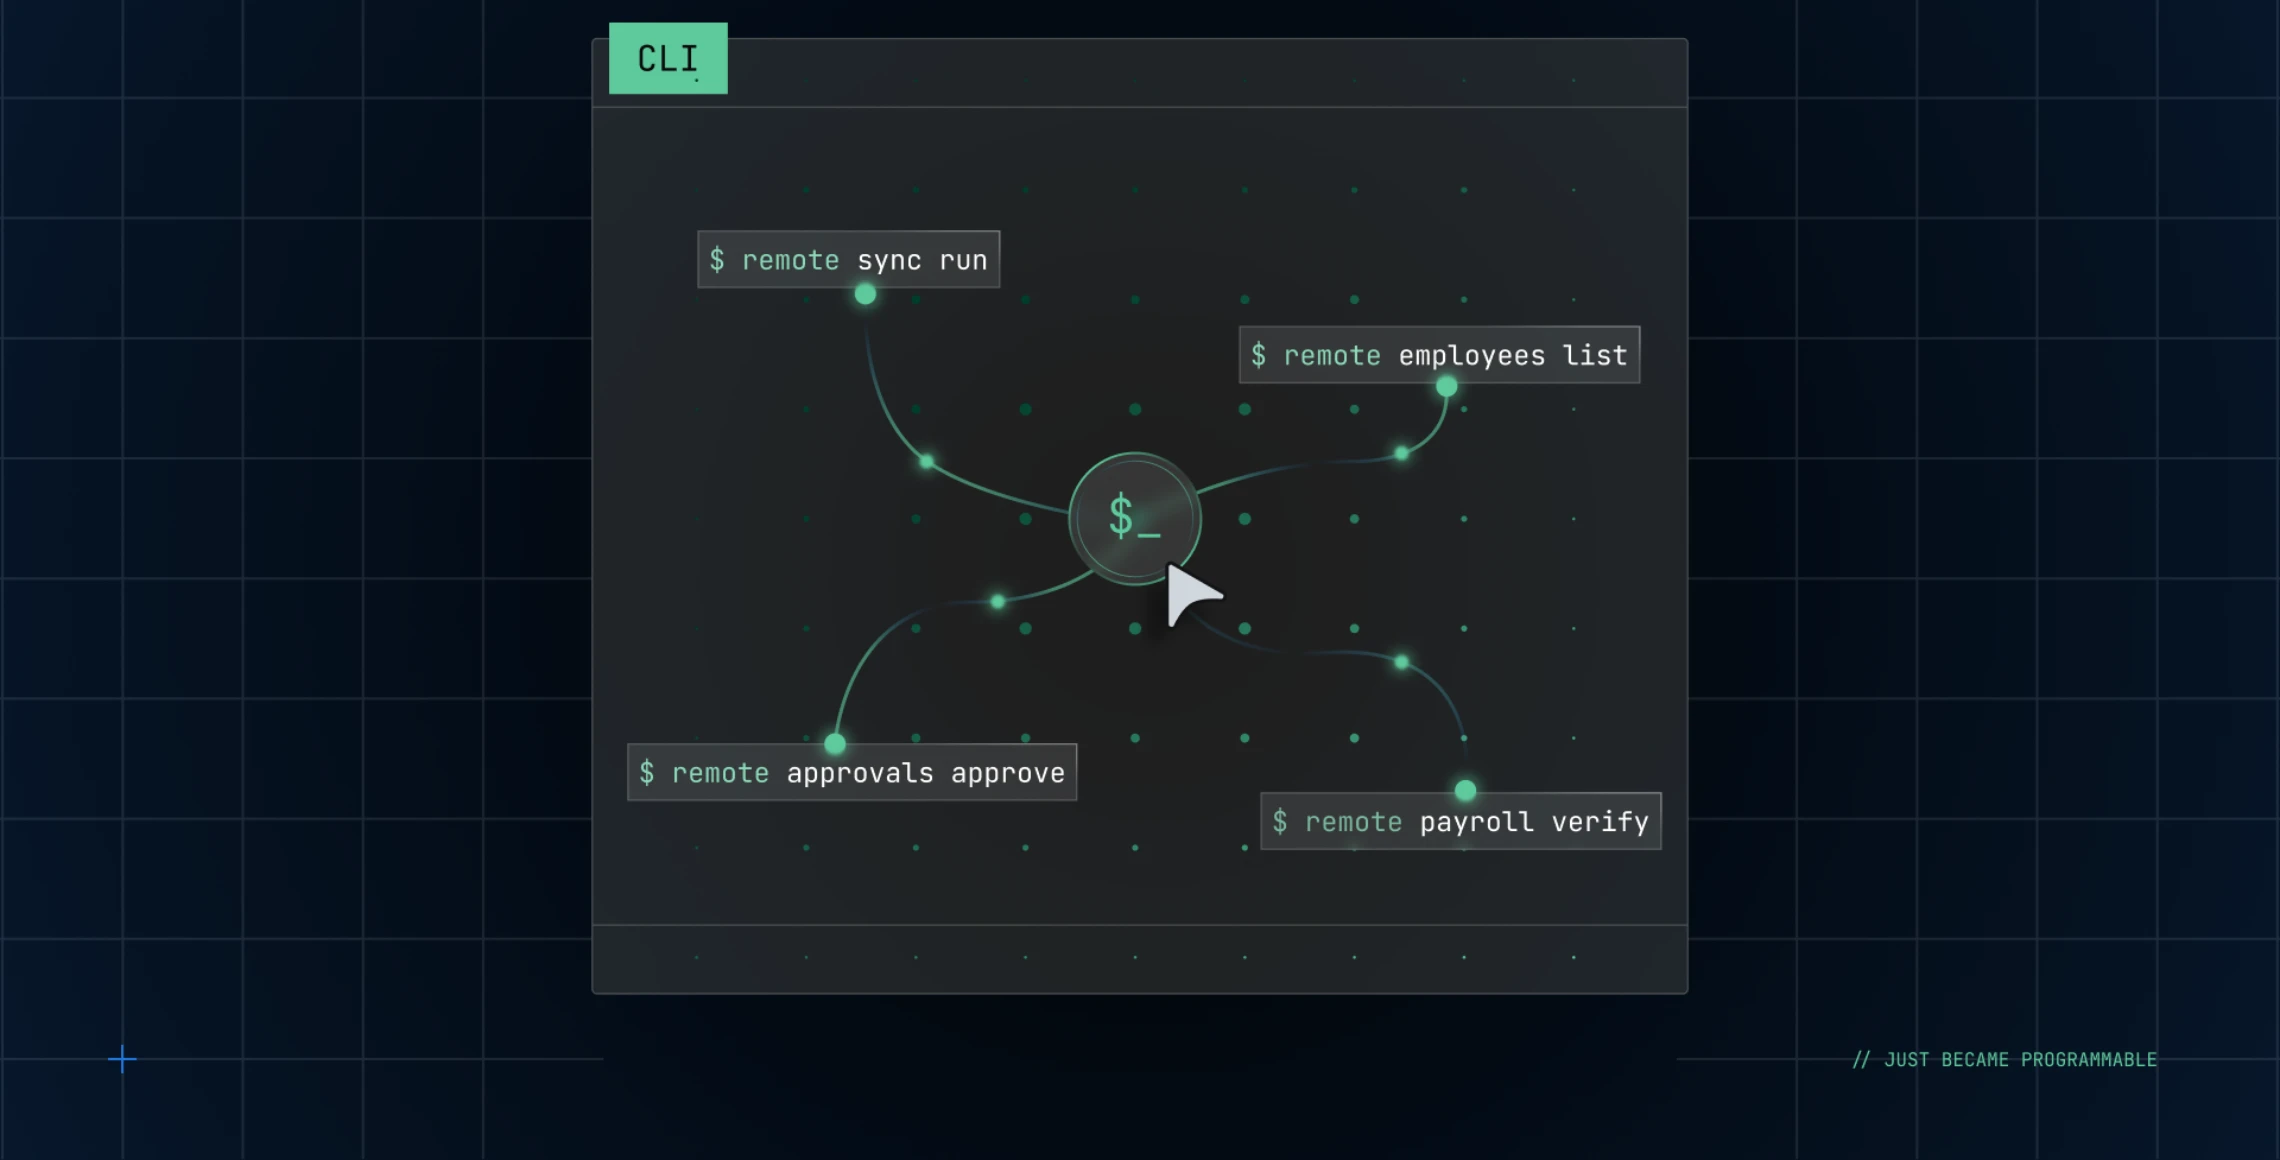
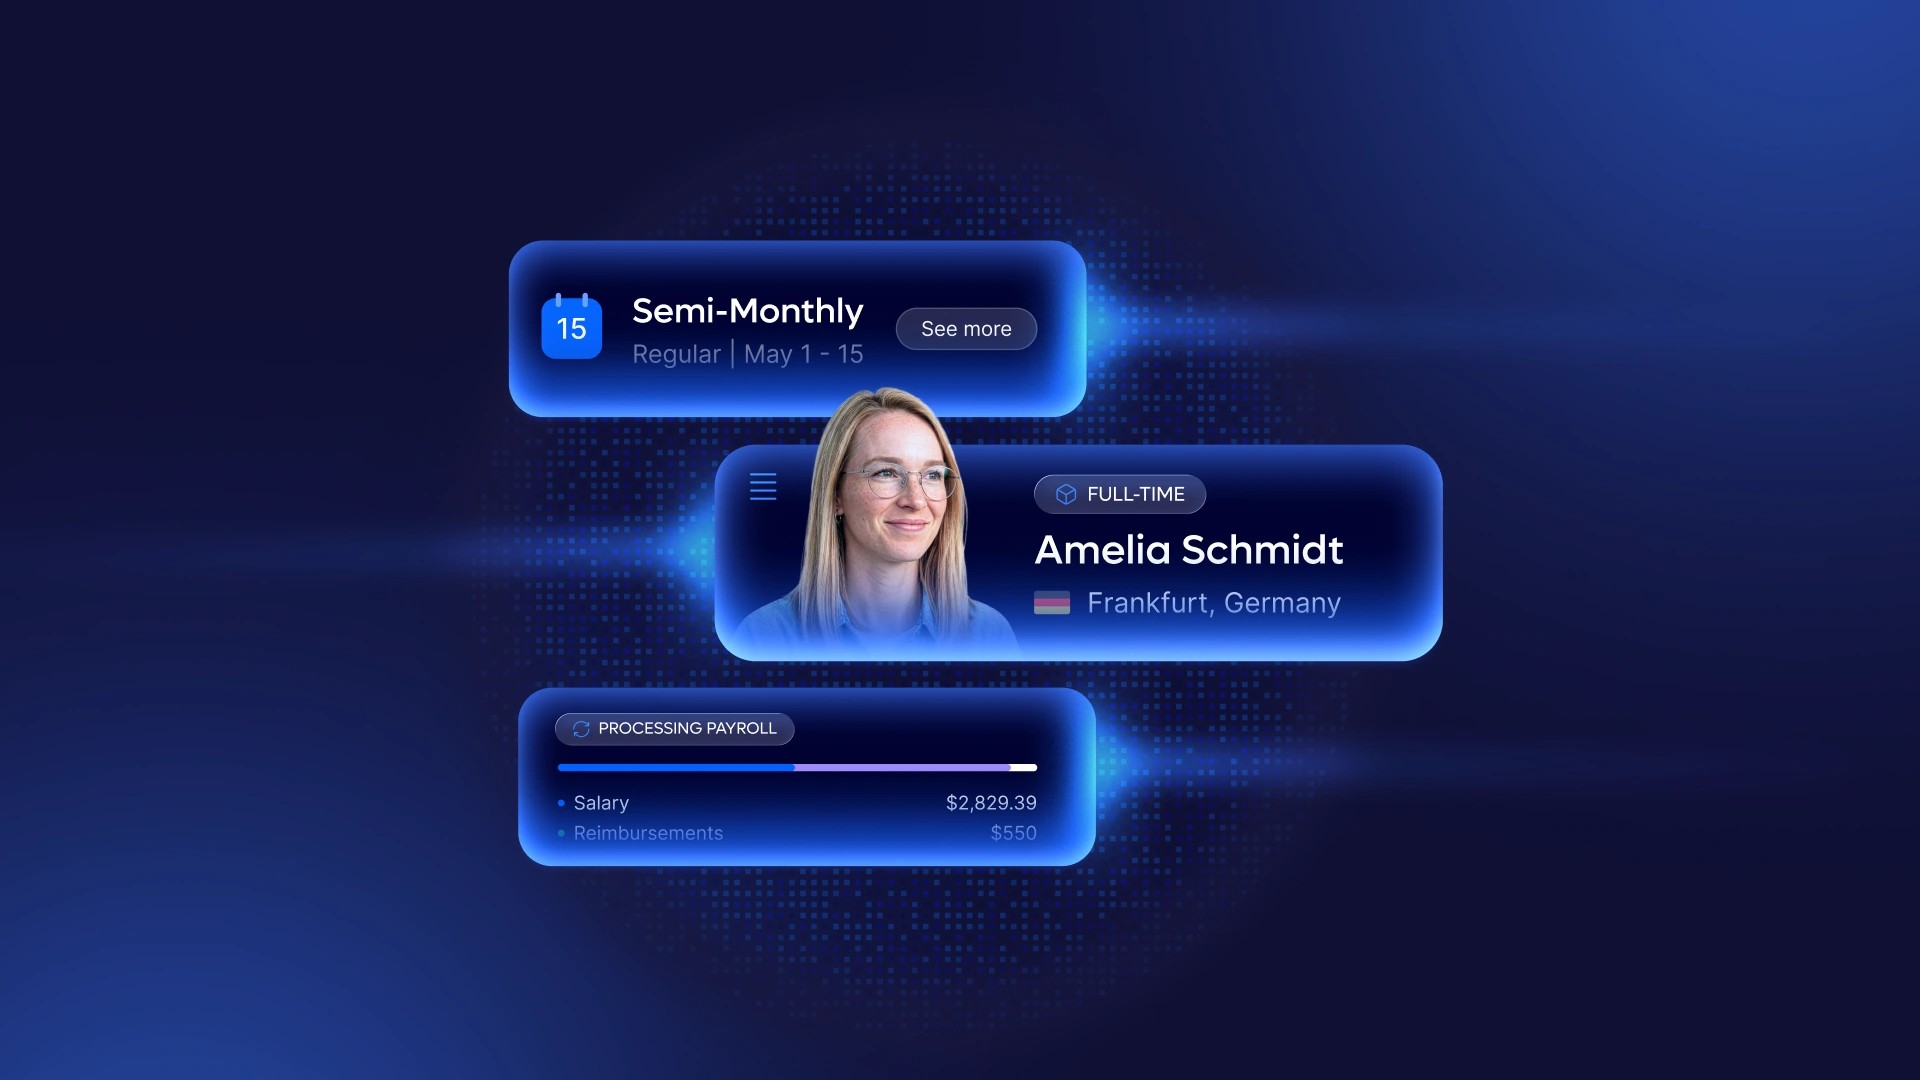
Q2 brought several important updates to Remote, including four larger launches — Custom Report Builder, Remote MCP, Remote CLI, and Remote AI Agents — alongside many improvements across payroll, contractors, benefits, and platform workflows.

Recent stories


.png?width=3840&quality=90&auto=webp&disable=upscale)